FAQ

Find Answers to Your Most Common Questions About Yodiwo and Our Solutions

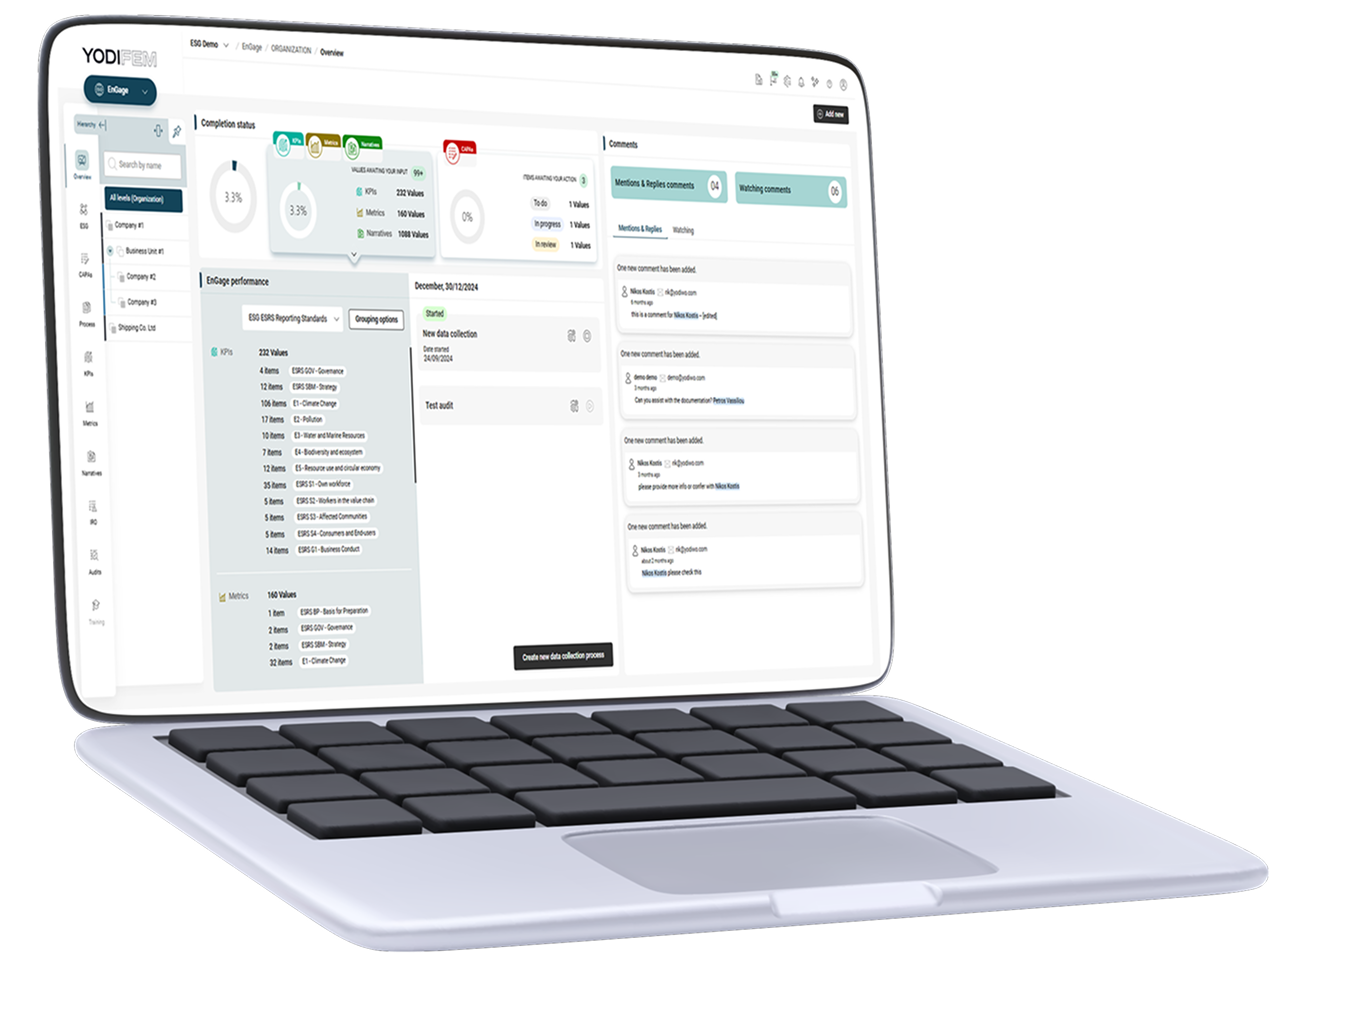
  1. YodiFEM is Yodiwo’s all-in-one AI-powered Full ESG management platform. It centralizes and automates the end-to-end sustainability process across environmental, operational, and organizational domains. Designed for both public and private sector needs, YodiFEM brings together ESG data management, real-time monitoring, predictive analytics, and compliance automation under one scalable solution.

  2. YodiFEM covers a wide ESG spectrum across:

    • Processes: ESG task workflows, employee scheduling, asset & task management
    • IoT Data: Live sensor integrations, smart devices, energy meters
    • People: HR systems, wellness monitoring, hot desking tools
    • Spaces: Workspace usage, energy optimization
    • Environment: CO₂ emissions, air quality, wellness KPIs
    • Cities: Smart city subsystems for traffic, waste, lighting, and more
  3. YodiFEM includes modular subsystems that can be deployed independently or combined:

    • EnGage (core): ESG data management, compliance, emissions reporting
    • Energy Monitoring & Management
    • Task & Asset Management
    • Hot Desking & Workspace Booking
    • Employee Scheduling & Shift Planning
    • IoT Integration & Analysis
    • Smart Retail Management (Plano360)
    • Smart City Management (YodiCity)


  4. No. YodiFEM is a modular platform, meaning you can select only the modules that match your organization’s needs. Whether you need ESG reporting, energy monitoring, workspace management, or smart city tools, each subsystem operates independently but also integrates seamlessly with the rest of the platform if needed.

  5. Yes. You can fully customize your YodiFEM setup by combining any number of modules -from ESG data management and emissions tracking to smart building operations or public sector urban management tools -creating a tailor-fit solution aligned with your goals, workflows, and budget.

  6. Yes. YodiFEM provides a unified platform interface. All active modules — EnGage, Energy, Task Management, Workspace, IoT, Smart City, etc. — are accessible from a single dashboard with centralized user access, monitoring, and reporting tools.

  7. YodiFEM’s pricing consists of a one-time setup fee and a recurring license fee, which can be billed annually or monthly.

    A.  The setup fee includes and varies based on:

    • Integration with third-party systems, if YodiFEM’s standard API cannot be used.
    • Training sessions requested by the customer.
    • Additional configuration tasks the customer prefers Yodiwo to handle, despite the availability of step-by-step “How-to” guides. These may include:
      • ESG framework configuration.
      • Digitization of the company’s organizational structure.

    B.  The recurring license fee is determined by:

    • The number and type of modules activated.
    • The volume of Data Points, which typically reflects:
      • The company’s size and internal structure (for ESG data management).
      • The number of connected devices and data sources (for energy and facility data).
    • The preferred hosting model:
      • Yodiwo Cloud
      • Customer’s private cloud
      • On-premises installation
  8. Yes. A demo version or pilot deployment can be arranged, allowing you to explore YodiFEM’s capabilities in your own environment. Contact the Yodiwo team for a tailored trial setup.

  9. YodiFEM is a cloud-native, AI-powered platform built with modern microservice architecture. It supports:

    • Open APIs for seamless integration (ERP, IoT, CRM, etc.)
    • Modular subsystems
    • IoT and real-time analytics pipelines
    • AI/ML models for prediction, auto-validation, and automation
    • Hosted on any major cloud (Azure, AWS, etc.), or on-premises if needed.
  10. YodiFEM is built around compliance needs, supporting:

    • CSRD, GRI, ESRS, SFDR, GHG Protocol, ISO 14064/14001/50001, and more
    • Predefined templates and frameworks
    • Audit-trails and version control
    • XBRL tagging
    • Gap analysis tools, corrective action (CAPA) tracking
    • AI tools to help align and verify ESG disclosures.
  11. All languages can be added based on deployment region and client requirements. All dashboards and forms are fully localizable.


  1. Desk booking is a system that allows employees to reserve workspaces, desks, or meeting rooms in advance through an easy-to-use platform. It ensures efficient workspace allocation, supports hybrid work models, and improves resource management. 

  2. Desk booking platforms like DESK operate through web and mobile applications, automate check in and out to update occupancy status and enable employees to : 

    • View real-time desk availability and reserve workspaces through an intuitive interface.  
    • Select desks or meeting rooms for single or recurring bookings  
    • Use QR codes for entry verification and desk confirmation. 

    Administrators can manage desk setups, booking rules, and notifications while accessing detailed analytics and reporting.

  3. A desk booking platform like DESK optimizes office resources, supports flexible work models, and reduces energy and space waste. Other benefits include: 

    • Enhanced employee productivity and satisfaction. 
    • Better air circulation and reduced overcrowding. 
    • Comprehensive reporting for workspace planning and ESG compliance.
       
  4. Hot desking is a flexible workspace system where employees do not have permanently assigned desks. Instead, they book or use available desks on a first-come, first-serve basis, depending on the system in place.

  5. A hot desking software like DESK provides several business benefits, such as: 

    • Reducing office operating costs by up to 30%. 
    • Saving 15–25% on office space requirements. 
    • Encouraging employee collaboration and flexibility. 
    • Maximizing office space utilization. 
  6. Desk booking allows employees to reserve a specific desk or meeting room in advance. It’s a way to ensure they have a guaranteed spot when they arrive. 

    Hot desking is more flexible. Employees don’t have fixed desks. Instead, they choose any available desk when they arrive, based on availability. 

    Key Difference: 

    • Desk booking is about reserving a specific desk ahead of time. 
    • Hot desking is about choosing any open desk on the spot. 

    Software like DESK offer both. 


  7. A hot desking and desk booking system like DESK is essential for organizations embracing hybrid work models or aiming for resource efficiency. It minimizes operational costs, supports ESG goals, and streamlines workspace management while enhancing employee satisfaction. 

  8. DESK is a cloud-based, fully customizable, GDPR-compliant platform  for smart hot desking and desk booking designed to optimize workspace management while supporting environmental, social, and governance (ESG) objectives. With native mobile and web apps, DESK provides real-time availability, rich analytics and real-time desk reservations, occupancy tracking, and automated reporting. It integrates seamlessly with systems like Office 365 and supports 3D space modeling for interactive booking experiences. 
     
    You can also check our explainer video to learn more. 

  9. You can book a desk or meeting room using the web or mobile application. Features include: 

    • An interactive floorplan for easy selection. 
    • Calendar views of upcoming bookings. 
    • Options to modify or cancel bookings. 
    • QR code entry for desk or room confirmation.
  10. Organizations with hybrid work models, shared office spaces, or a focus on sustainability and efficiency can benefit from a desk booking system. It’s ideal for companies aiming to optimize space, save energy, and improve employee satisfaction. 

  11. With DESK, you can easily cancel or modify bookings through the platform. Changes are reflected in real-time to maintain accurate desk availability. 

  12. Yes, DESK offers a demo.

    Contact us to explore how DESK can transform your workspace management. 

  13. Yes, DESK increases productivity by: 

    • Reducing time spent searching for available desks or rooms. 
    • Supporting efficient booking processes and minimizing disruptions. 
    • Improving air circulation and resource planning. 
    • Enabling administrators to allocate resources effectively based on real-time data. 
  14. DESK supports multi-site management, enabling centralized control across multiple office locations. It integrates seamlessly with existing systems and scales to match your organization’s growth and needs. 

  15. DESK uses advanced IoT sensors, such as the Milesight VS121, to detect occupancy with up to 98% accuracy. Key features include: 

    • Privacy-focused design: Only counter values are transmitted over the LoRaWAN® network. 
    • Seamless configuration via Wi-Fi for setup without extra tools. 
    • Real-time occupancy data to inform workspace optimization and energy-saving strategies.
      The sensors integrate with DESK to provide actionable insights into desk and room utilization. 
  16. Desking analytics offer insights into space utilization, booking trends, and occupancy patterns. Using machine learning and advanced analytics tools, DESK provides: 

    • Heatmaps of high-use and underutilized areas. 
    • Predictive trends for space allocation planning. 
    • Real-time data integration for immediate decision-making.
      These analytics empower businesses to optimize resource usage, enhance employee satisfaction, and improve ESG performance. 

    These analytics empower businesses to optimize resource usage, enhance employee satisfaction, and improve ESG performance. 

  17. DESK generates detailed ESG-specific reports, including energy savings, occupancy trends, and usage forecasts. These reports can support sustainability compliance, cost control, and workspace optimization strategies. 

    • Occupancy Reports: Show real-time and historical desk usage to identify patterns and trends. 
    • Use Case: Plan desk allocations, adjust layouts, and support flexible work policies. 
    • Energy Usage Reports: Highlight energy savings achieved by reducing lighting and HVAC use in unoccupied areas. 
    • Use Case: Demonstrate environmental sustainability and reduce utility costs. 
    • Utilization Forecasts: Predict desk demand using historical data and trend analysis. 
    • Use Case: Plan for future needs, reduce unused resources, and improve long-term space management. 
  18. DESK supports integrations with a wide range of systems, including: 

    • Microsoft Ecosystem: Office 365, Outlook Calendar, MS Teams, and Azure AD. 
    • Third-Party Platforms: DESK’s API allows integration with virtually any system for tailored solutions. 
    • Other Yodiwo Modules: Combine DESK with modules like Park (parking management), Sense (energy control), and Task (task automation), Energy (Energy Management System), EnGage (ESG Data Management & reporting).These integrations allow seamless management of desks, environmental controls, and operational workflows. 
  19. DESK helps support your environmental, social, and governance (ESG) objectives by: 

    • Environmental Impact: By optimizing space usage and reducing energy consumption, DESK minimizes the need for excess lighting, heating, and cooling in unoccupied areas, contributing to lower carbon footprints. 
    • Social Responsibility: It enables flexible and hybrid work models, improving employee satisfaction, inclusivity, and well-being. 
    • Governance: DESK provides detailed reports on space utilization and energy savings, helping you track progress on sustainability goals and comply with regulatory requirements. 
  20. For pricing details, please contact us. DESK offers flexible pricing models tailored to your organization’s size and requirements. 

  1. Task and asset management refers to the process of efficiently tracking, scheduling, and managing tasks and assets within a facility or organization. It involves overseeing maintenance schedules, monitoring asset health, and ensuring tasks are completed on time to optimize operations and extend asset lifespans. 

  2. Effective task and asset management with software like TASK improves operational efficiency, reduces downtime, and lowers maintenance costs. By optimizing resource use and ensuring tasks are completed on schedule, it drives productivity, enhances collaboration, and supports the organization’s bottom line 

  3. Investing in task and asset management systems like TASK ensures better operational control, reduces unnecessary costs, and improves asset longevity. It helps facilities stay organized, maintain compliance, and meet key performance indicators (KPIs) more efficiently, ultimately leading to better resource utilization and higher returns on investment (ROI). 

  4. TASK is a comprehensive, cloud-based task and asset management platform by Yodiwo that simplifies the tracking of facility tasks, asset maintenance, and project management. It offers real-time task monitoring, integration with other systems, detailed reporting, and customizable features for both technicians and managers. 

  5. TASK streamlines the management of large-scale projects, task assignments, and reporting. It allows facilities managers to track tasks and assets, allocate resources efficiently, set deadlines, and generate real-time reports, helping them improve operations and reduce operational waste. 

  6. TASK fosters collaboration by enabling teams to track progress, share task updates, and communicate more effectively. Its user-friendly mobile app allows employees to manage their tasks on the go, while managers can monitor performance and streamline workflow, increasing overall productivity. 

  7. Yes, TASK can seamlessly integrate with various third-party systems such as ERP tools, MS Teams, and other task management solutions. This integration ensures a more connected and efficient workflow across all departments. TASK can also integrate with any of the other YodiFEM’s modules (like Desk Management, Energy Management etc.) 

  8. TASK stands out due to its deep integration with asset management, customizable task automation, and real-time analytics. It also offers easy-to-use mobile applications for field technicians, detailed reporting, and a seamless connection to other enterprise systems, which provides a more comprehensive solution. 

  9. Any organization that manages facilities, assets, or complex projects can benefit from task and asset management systems like TASK by Yodiwo. This includes facility managers, maintenance teams, project managers, and organizations aiming to improve operational efficiency, resource utilization, and compliance. 

  10. TASK provides rich analytics, including real-time tracking of task progress, team performance, asset health, response times, and maintenance completion rates. It also offers exportable reports for compliance, KPI monitoring, and in-depth analysis of individual and team performance. 

  11. TASK supports integrations with various third-party systems such as ERP tools, MS Teams, and task management platforms like Jira and Fiix. It is also already integrated with YodiFEM’s energy management and ESG reporting systems, ensuring a holistic approach to facility management. 

  12. TASK helps with ESG goals by reducing operational waste through efficient maintenance and task management. It ensures timely completion of tasks, which optimizes resource usage, extends asset lifespan, and promotes sustainability. The system also supports social and governance KPIs by improving employee engagement, monitoring response times, and ensuring regulatory compliance. 

  13. Yes, you can try out TASK to see how it fits your organization’s needs. Contact us to request a demo to explore its features and how it can benefit your task and asset management operations. 

  14. Pricing for TASK is customized based on your organization’s needs, and the level of integration required.

    Please contact us for a tailored quote based on your specific requirements. 

  1. Dynamic shift management and planning involves the flexible scheduling of employee shifts, considering personal preferences, project requirements, and resource availability. It ensures efficient allocation of workforce hours while maintaining operational flexibility and employee satisfaction. 

  2. Shift scheduling is the process of assigning specific working hours to employees based on organizational needs and employee availability. Effective shift scheduling balances operational demands with employee preferences, promoting a well-organized and productive work environment. 

  3. Investing in dynamic shift management software like TIMEBOX improves workplace efficiency, reduces scheduling conflicts, and enhances employee satisfaction. It ensures optimal resource utilization, minimizes absenteeism, and supports compliance with labor laws and time tracking regulations. 

  4. Dynamic shift management systems like TIMEBOX by Yodiwo are ideal for organizations with complex scheduling needs, such as healthcare facilities, manufacturing plants, retail chains, and service industries. Any business seeking to improve workforce efficiency and employee satisfaction can benefit from such a system. 

  5. TIMEBOX by Yodiwo is a smart platform for dynamic shift management and hours registration. It allows organizations to schedule employee shifts efficiently, log working hours seamlessly, and comply with labor laws. It integrates with IT, HR, and governmental systems, making time tracking and reporting effortless. 

  6. TIMEBOX automates time logging and integrates with governmental platforms to ensure accurate and timely reporting. This compliance-focused approach simplifies workplace inspections and eliminates the risks associated with manual time tracking errors. 

  7. TIMEBOX by Yodiwo improves shift scheduling by: 

    • Empowering employees to set availability preferences, leading to increased job satisfaction and reduced absenteeism. 
    • Reducing scheduling conflicts with real-time updates with 59% reduction in scheduling errors 
    • Supporting flexible work arrangements, which studies show can boost productivity and employee morale. 
    • Delivering accurate shift notifications and reminders, ensuring seamless communication and reducing missed shifts. 
    • 100% compliance  with labor laws, reducing the risk of fines and enhancing organizational transparency 
    • 39% faster schedule creation compared to traditional manual methods (e.g., spreadsheets or paper-based systems). 
  8. TIMEBOX fosters workplace communication by delivering automated alerts and reminders about shifts, updates, or time-off requests. Its real-time updates ensure employees and managers stay informed of schedule changes, improving collaboration and reducing misunderstandings. 

  9. Yes, TIMEBOX offers an open API that allows seamless integration with third-party systems, including ERP platforms, HR tools, and YodiFEM modules like DESK and TASK, or Yodiwo’s ESG Data Management & Reporting Software. This flexibility ensures a comprehensive workplace management solution. 

  10. TIMEBOX by Yodiwo automates time logging through QR codes or beacon technology. Employees can register their start and end times effortlessly, ensuring accurate and tamper-proof records without requiring manual input or supervision. 

  11. Real-time schedule updates ensure that all stakeholders are immediately aware of any changes, such as shift modifications or additional assignments. This reduces confusion, improves transparency, and allows employees to adapt quickly to updated schedules. 

  12. TIMEBOX supports ESG goals by: 

    • Environmental KPIs: Optimizing workspace usage and reducing energy waste by aligning employee shifts with workspace availability. 
    • Social KPIs: Enhancing employee well-being through flexible shift scheduling and improved work-life balance. 
    • Governance KPIs: Ensuring compliance with labor laws and promoting transparency through accurate and automated time tracking. 

    TIMEBOX data can be integrated with YodiFEM’s ESG Data Management & Reporting module for a complete approach to sustainability. 

  13. Yes, you can try out TIMEBOX to evaluate how it fits your organization’s needs. Contact us to request a demo to explore its features and benefits. 

  14. Pricing for TIMEBOX is tailored to your organization’s specific requirements, including the level of integration, and additional features.

    Please contact us for a customized quote. 

  1. An IoT data management software like SENSE is a system that collects, processes, analyzes, correlates and visualizes data from all IoT-connected devices, such as smart sensors and meters. It enables organizations to monitor real-time metrics, detect anomalies, automate actions, and optimize resource usage. In the context of energy and ESG, this software ensures seamless data flow, enabling precise decision-making and compliance with sustainability goals but also better management of the corrective actions. 

  2. Companies can receive IoT data by deploying a network of interconnected IoT devices such as smart sensors, meters, and actuators within their facilities. These devices are equipped with embedded connectivity (e.g., Wi-Fi, Bluetooth, LoRaWAN) that enables real-time data transmission to a central IoT platform like SENSE 


    The platform acts as a data aggregation and analytics hub, where data from various sources—such as energy meters, environmental sensors (e.g., temperature, humidity, CO₂ levels), occupancy sensors, and building management systems (BMS)—is collected and processed. Through APIs and standard communication protocols (e.g., MQTT, REST), the IoT platform integrates data from these disparate systems into a unified view.  


    Advanced analytics and correlation algorithms within the platform allow for real-time monitoring, anomaly detection, and predictive insights, enabling businesses to make data-driven decisions and optimize operations for improved energy management, cost savings, and sustainability outcomes. 

  3. Collecting IoT data is crucial for organizations looking to optimize operations, enhance sustainability, and ensure compliance. By leveraging real-time insights from IoT sensors and smart devices, businesses can detect inefficiencies, automate processes, reduce energy and resource waste, and improve ambient conditions and decision-making via correlation analysis. IoT-driven analytics enable proactive maintenance, cost savings, and audit-ready ESG reporting, ensuring transparency and regulatory adherence while driving long-term sustainability and operational efficiency. 

    Example 

    • Continuous Monitoring: Smart sensors track indoor air quality parameters 24/7, providing real-time insights into air quality conditions across various spaces within a building. 
    • Correlating with Other Data: These sensors can be integrated with energy usage and space occupancy data. For example, when occupancy levels increase, air quality might decline due to higher CO₂ production, so air ventilation and filtration systems can automatically adjust. 
    • Real-Time Feedback and Alerts: By monitoring IAQ parameters in real-time, businesses receive instant alerts when air quality falls below acceptable thresholds, enabling quick corrective actions (e.g., increasing ventilation or adjusting HVAC systems). 
  4. Integrating IoT data into ESG reporting enhances accuracy, transparency, and efficiency by providing real-time, automated tracking of critical Environmental, Social, and Governance (ESG) metrics. This enables organizations to monitor energy consumption, emissions, workplace safety, employee well-being, and other sustainability KPIs, ensuring compliance with ESG frameworks. 

    Examples: 

    • Compliance Automation: Compliance Automation: Real-time IoT data feeds directly into ESG reporting frameworks, ensuring audit-ready reports and eliminating manual data collection errors. 
    • Workplace Health & Safety: IoT indoor air quality sensors monitor CO₂ levels, VOCs, temperature, humidity, and noise levels to ensure a safe and healthy working environment. Automated alerts notify facility managers of unsafe conditions, improving employee well-being and reducing risks associated with Sick Building Syndrome (SBS). 
    • Water & Waste Management: Smart water meters track water usage, leaks, and wastewater quality, while IoT waste management solutions monitor waste levels in bins, recycling efficiency, and landfill diversion rates, helping companies reduce resource consumption and optimize waste disposal. 
  5. SENSE not only collects real-time data but also enhances energy management by correlating IoT data from multiple systems, including energy meters, occupancy sensors, building management systems, and weather data. This integration enables businesses to optimize energy consumption, detect inefficiencies, and make informed, data-driven decisions to minimize waste. By analyzing these correlations, SENSE helps organizations boost operational efficiency, reduce costs, and achieve sustainability goals, ensuring energy savings and regulatory compliance.


    For example, FollowMeLight integrates live occupancy data with electricity consumption data to dynamically adjust lighting levels based on real-time occupancy. In large office spaces or warehouses, when occupancy sensors detect no activity in certain areas, the system automatically reduces or turns off lighting in those zones while maintaining optimal lighting in active areas. This results in significant energy savings—up to 80%—by eliminating wasted energy in unoccupied spaces, all while contributing to sustainability goals and reducing operational costs. 

    By utilizing this data correlation, SENSE enables smarter energy management, ensuring that businesses can reduce waste, optimize energy use, and stay aligned with their sustainability objectives. 

  6. Yodiwo’s FollowMeLight technology, part of the YodiFEM platform, is an intelligent lighting control system that dynamically adjusts brightness based on real-time movement detection. By integrating Renesas Electronics’ and IOSEA Inc.’s Real-Time Location Detection with LEDVANCE’s DALI 2 lighting systems, FollowMeLight reduces energy consumption by up to 80%, optimizes lighting efficiency, and achieves ROI in approximately three years. This innovation enhances both cost savings and sustainability, making it ideal for warehouses, logistics centers, and large commercial spaces. 

    Watch the demonstration of the FollowMeLight solution on the YodiFEM platform here. 

  7. A company can receive IoT data through the deployment of IoT devices, such as smart sensors, meters, and gateways, that are connected to a network. These devices are typically equipped with wireless communication protocols such as Wi-Fi, Bluetooth, Zigbee, LoRaWAN, or cellular networks (e.g., 5G) to transmit data in real-time. The data collected by these devices is sent to an IoT platform or cloud-based service via secure communication channels (e.g., MQTT, HTTP, CoAP, or RESTful APIs). 

  8. Yes, Yodiwo provides comprehensive support for the integration and deployment of smart sensors and smart meters, leveraging IoT technology for advanced data analysis and control.

  9. Investing in smart sensors and meters offers significant advantages for businesses seeking to optimize their operations, improve energy efficiency, and meet sustainability goals. 

    1. Real-Time Monitoring and Data Collection
      Smart sensors and meters continuously collect data in real time, including key metrics like energy consumption, temperature, humidity, light levels, occupancy, and CO₂ levels. This data provides businesses with up-to-the-minute insights into their operations, allowing them to immediately detect inefficiencies and make adjustments to optimize performance.
       
    1. Energy Efficiency and Cost Reduction
      By identifying inefficiencies and areas of high energy consumption, smart meters help organizations optimize their energy usage. This leads to significant cost reductions while enhancing the overall sustainability of operations. 
    1. Improved Operational Efficiency
      By integrating data from smart sensors and meters into a centralized system, businesses can gain a comprehensive view of their operations. For example, data from energy meters, occupancy sensors, and even weather forecasts can be correlated to optimize energy consumption. This holistic view enables smarter decisions, ensuring that resources are used efficiently across different areas. 
  10. SENSE is a cutting-edge subsystem of the YodiFEM platform that utilizes IoT data for real-time monitoring, advanced correlation analysis, anomaly detection 

    and predictive insights. It helps businesses optimize energy consumption ambinet conditions,  reduce waste, track sustainability KPIs, and lower operational costs through data-driven decision-making and dynamic system control. 


  11. Unlike traditional analytics, SENSE incorporates IoT-driven correlation analysis, anomaly detection, and real-time alerts. It identifies hidden patterns and inefficiencies, allowing businesses to take immediate corrective actions. Its advanced capabilities provide more granular, actionable insights, ensuring optimal energy management and operational efficiency. 

  12. By integrating data from smart sensors and meters into a centralized system, businesses can gain a comprehensive view of their operations. For example, data from energy meters, occupancy sensors, and even weather forecasts can be correlated to optimize energy consumption. This holistic view enables smarter decisions, ensuring that resources are used efficiently across different areas. 

  13. Granular IoT data analysis with a software like SENSE empowers businesses to optimize their energy management by providing detailed, real-time insights into energy consumption patterns. By closely monitoring  and correlating also variables such as temperature, humidity, occupancy, and equipment performance, organizations can identify inefficiencies, predict future energy demands, and take proactive actions to reduce waste. 

    For instance, studies show that implementing energy management systems that utilize granular IoT data can lead to energy savings of up to 30% in commercial buildings by optimizing lighting, heating, and cooling systems (U.S. Department of Energy, 2020). Additionally, IoT-powered predictive maintenance can reduce equipment downtime by 40%, preventing costly repairs and enhancing system reliability (McKinsey & Company, 2019). This combination of precise monitoring and intelligent automation contributes to a 10-15% reduction in energy costs annually, driving both cost efficiency and sustainability in operations (International Energy Agency, 2017). 

  14. Correlation analysis in energy management involves linking operational data—such as energy usage, environmental factors (temperature, humidity), and system performance—to uncover patterns and identify inefficiencies. This analysis helps businesses automate systems for energy efficiency and detect anomalies that could impact sustainability goals. 
     

  15. Environmental dashboards in softwares like SENSE are advanced, data-driven visual platforms that provide a centralized view of an organization’s environmental metrics, including energy consumption, water usage, emissions, waste generation, and indoor air quality. These dashboards integrate data from IoT sensors, smart meters, and other monitoring systems to deliver real-time analytics, allowing businesses to observe and track their environmental performance against specific sustainability goals and KPIs. 


    Through data visualization, organizations can assess patterns and trends in their operations and identify inefficiencies. For example, an environmental dashboard may highlight fluctuating energy consumption in certain areas, prompting an investigation into potential operational issues or equipment malfunctions. 


  16. SENSE delivers operational cost savings through its advanced IoT data analysis, real-time monitoring, and predictive analytics, which together help businesses optimize energy consumption, streamline operations, and reduce unnecessary expenditures.
     

    • Identifying inefficiencies: By continuously analyzing energy and operational data, SENSE identifies inefficiencies in real-time. For instance, it may detect areas where energy consumption is higher than expected, such as underutilized lighting or HVAC systems running at full capacity during non-peak hours 


    • Automating corrective actions: SENSE’s automation capabilities allow for immediate adjustments without manual intervention. For example, it can automatically adjust lighting levels based on occupancy or environmental conditions, reducing energy consumption when areas are unoccupied or conditions do not require full illumination. This automation reduces the need for human oversight, cutting down on labor costs and minimizing errors.
       
    • Optimizing resource allocation: Through its correlation analysis, SENSE enables businesses to optimize how resources are allocated. For example, in a manufacturing facility, SENSE might show that certain machines are consuming excessive energy during low production periods, prompting businesses to adjust operation schedules or shift workloads to minimize energy costs.
       
    • Preventing costly disruptions: SENSE’s predictive maintenance capabilities help prevent system malfunctions or equipment failures that could lead to expensive repairs or downtime. By monitoring equipment performance and identifying early warning signs of potential issues, SENSE allows businesses to schedule maintenance activities before they become costly disruptions. 
  17. Yes, SENSE is designed for seamless integration with a variety of third-party systems, including building management systems, energy management systems, and ERP software. This ensures that businesses can consolidate their data from multiple sources into a single, comprehensive operational overview, simplifying management and decision-making. 
     

  18. SENSE is a centralized IoT data management and analytics platform that connects and integrates data from various subsystems, including ENERGY (energy management) and SAFE (environmental monitoring) by Yodiwo. SENSE doesn’t just collect data but also performs correlation analysis to optimize energy usage and environmental conditions across an organization. It enables businesses to make data-driven decisions, detect anomalies, and identify areas for operational improvement. 

    On the other hand: 

    • ENERGY focuses specifically on tracking and managing energy-related data, including electricity, gas, water, and waste. It provides real-time monitoring and reporting for energy consumption, CO₂ emissions, and sustainability goals. 
    • SAFE focuses on monitoring ambient environmental conditions, such as temperature, humidity, CO₂ levels, and air quality, which are crucial for occupant health and comfort. 
  19. SENSE ensures robust data privacy and security through industry-standard encryption, secure data transmission protocols, and access controls. It is designed to meet the highest security standards to protect sensitive operational data and ensure compliance with data privacy regulations.

  20. Any organization aiming to optimize energy usage, improve sustainability efforts, reduce costs, and enhance operational efficiency can benefit from IoT advanced analytics. This includes businesses, municipalities, industrial facilities, and any organization looking to gain deeper insights into their energy and environmental performance.

  21. SENSE offers mobile apps and responsive web interfaces that allow users to access real-time data, monitor performance, and control energy settings from anywhere. Whether on-site or remote, users can stay connected to the platform and take necessary actions on-the-go. 

  22. Pricing for SENSE depends on factors such as the size of the organization, the specific features required, and the level of customization needed. Yodiwo offers tailored pricing plans to meet the unique needs of each business.

    Contact us  for a personalized quote that aligns with your requirements and goals. 

  1. Environmental monitoring involves the continuous tracking of indoor conditions such as air quality, temperature, humidity, CO₂ levels, sound, and light. This practice is crucial because poor indoor environments can lead to Sick Building Syndrome (SBS), which negatively impacts occupant health and productivity. Studies have shown that SBS can decrease productivity and increase absenteeism, leading to significant economic losses. Implementing effective environmental monitoring with solutions like SAFE helps create healthier, more comfortable spaces, thereby enhancing overall well-being and efficiency.

  2. IoT (Internet of Things) technology enhances environmental monitoring by deploying smart sensors and gateways,  Yodiwo’s WisperPro, to collect real-time data on various environmental parameters. SAFE utilizes a network of LoRaWAN devices and 3D cameras to:

    • Monitor air quality by measuring factors like AQI, VOCs, CO₂, temperature, and humidity.
    • Track occupancy and movement patterns without compromising privacy.
    • Detect sound and light levels that may affect productivity and comfort.
    • Trigger automatic alerts and adjustments based on predefined thresholds (when integrated with SENSE).

    This IoT-driven approach enables data-driven building management, leading to smarter decision-making and optimized environmental conditions.

    1. Investing in environmental monitoring with YodiSafe offers substantial benefits:

      Neglecting indoor environmental quality can result in significant economic losses due to decreased productivity and increased healthcare costs.

  3. Real-time monitoring provides immediate insights into workplace conditions, allowing for swift corrective actions. For example:

    • Air Quality: Detecting elevated CO₂ levels can prompt increased ventilation, preventing fatigue and enhancing concentration.
    • Thermal Comfort: Monitoring temperature and humidity ensures optimal thermal conditions, reducing discomfort and potential health issues.
    • Lighting and Noise: Adjusting lighting and controlling noise levels can prevent eye strain and stress, contributing to a more comfortable environment. These manual or automated (via SENSE) adjustments help create a healthier, more focused, and comfortable environment.”

    Implementing such measures has been associated with improved employee performance and reduced absenteeism.

  4. Indoor Air Quality (IAQ) monitoring involves assessing the levels of pollutants and environmental factors within indoor spaces. SAFE, for example, employs advanced multi-sensor devices to measure parameters like CO₂, VOCs, temperature, and humidity. Maintaining good IAQ is crucial because:

    • Health Benefits: Poor IAQ can lead to respiratory issues, headaches, and fatigue, contributing to SBS.
    • Productivity Gains: Improved IAQ has been linked to enhanced cognitive function and productivity.
    • Regulatory Compliance: Ensures that indoor environments meet health and safety standards.
    • Employee Satisfaction: A healthy indoor environment can increase employee satisfaction and retention.

    By continuously monitoring IAQ, SAFE helps maintain a healthier, more productive workplace.


  5. Occupancy tracking enables buildings to reduce energy waste by adjusting lighting, HVAC, and ventilation systems based on real-time presence (automation available only with SENSE). SAFE uses advanced 3D cameras and IoT sensors to detect people flow and space utilization, enabling dynamic control over energy-consuming systems.

    ✅ According to the U.S. Department of Energy, smart occupancy-based control systems can reduce HVAC energy use by up to 30% in commercial buildings.

  6. SAFE is Yodiwo’s smart environmental monitoring solution, part of the YodiFEM platform. It uses a combination of IoT sensors, multi-protocol gateways, and 3D cameras to monitor and manage indoor conditions such as air quality, sound, light, and occupancy in real time.

    It helps businesses of all sizes—offices, retail, public spaces—create healthier, safer, and more efficient spaces with features like:

    • Real-time dashboards and analytics
    • Mobile and digital signage tools
    • Seamless integration with energy and facility management systems
  7. Sick Building Syndrome (SBS) is linked to poor indoor environmental conditions such as stale air, inconsistent temperatures, and inadequate lighting. SAFE actively prevents SBS by:

    • Monitoring air quality metrics like CO₂, VOCs, and humidity
    • Detecting comfort-related issues (noise, lighting, temperature fluctuations)
    • Alerting facility managers for immediate corrective action (only when SAFE is used in combination with the SENSE module)

    📊 Research from Harvard T.H. Chan School of Public Health shows that better air quality can improve cognitive function by up to 61%. SAFE helps maintain those healthy parameters around the clock.

  8. Environmental monitoring has a direct impact on both physical health and mental performance. With SAFE, businesses can track and maintain optimal indoor conditions to:

    • Improve air quality and reduce respiratory issues
    • Optimize comfort to reduce absenteeism
    • Create a focused, distraction-free environment

    📊 The World Green Building Council reports that better ventilation can lead to an 11% increase in productivity and a 35% reduction in short-term sick leave.

  9. SAFE collects and analyzes a wide range of environmental and occupancy data using wireless LoRaWAN sensors, stereoscopic 3D cameras, and additional smart building sensors. Parameters include:

    • Air Quality: CO₂, VOCs, temperature, humidity, air pressure
    • Occupancy: People count, flow density, movement patterns
    • Ambient Conditions: Sound levels, light intensity
    • Custom Metrics: Set rules and alerts for zone-specific thresholds

    All data is processed in real time via Yodiwo’s WisperPro IoT Gateway or in the cloud, delivering accurate insights for smarter facility management.

  10. SAFE leverages IoT by connecting real-time sensors and 3D cameras to collect data on air quality, occupancy, noise, lighting, and more. These devices communicate wirelessly (via LoRaWAN, Wi-Fi, or other protocols) and feed data into the YodiFEM platform using WisperPro, Yodiwo’s edge computing gateway.

    But SAFE doesn’t work alone—when combined with SENSE, Yodiwo’s centralized data analytics engine, the system doesn’t just monitor—it analyzes. SENSE correlates data from SAFE (environmental conditions)  and/or ENERGY (Energy management systems) to identify trends, anomalies, and optimization opportunities with alerts and automated rules for your entire facility.

  11. SAFE is built to comply with strict privacy and cybersecurity standards. Here’s how it protects your organization:

    • Anonymized occupancy tracking: 3D cameras monitor people flow without facial recognition or personal identification.
    • End-to-end data encryption across networks and platforms.
    • Role-based access control, ensuring only authorized personnel can view or manage sensitive data.
    • GDPR compliance is embedded into the system design.

    SAFE offers full transparency and control over environmental monitoring, without compromising individual privacy.

  12. Yes! SAFE is designed to be modular, open, and highly integrable. It connects with:

    • BMS (Building Management Systems)
    • Third-party IoT platforms and APIs
    • Energy platforms like Yodiwo’s ENERGY
    • Task and workspace tools like Yodiwo’s TASK and DESK modules
    • And most importantly, the SENSE subsystem, which unifies and in depth analyzes and correlates data from multiple sources (including SAFE and ENERGY) for cross-functional insights and automated actions.
  13. SAFE offers a deeply customizable dashboard experience:

    • Custom metrics: Choose which environmental KPIs to track-CO₂, VOCs, noise, light, IAQ index, occupancy, etc.
    • Visual displays: Real-time graphs, heatmaps, and alerts tailored to specific zones, departments, or user roles.
    • Personalized rules: Set individual thresholds for different rooms or zones and define what triggers alerts or automated actions. (when SAFE is connected with SENSE.)
    • Weather integration: Combine external weather data to anticipate and optimize indoor conditions.
    • Public display: Use digital signage to show live environmental conditions at entrances, boosting trust and transparency.
  14. SAFE reduces unnecessary energy usage by aligning HVAC, lighting, and ventilation systems with real-time occupancy and air quality data. By detecting when and where people are present—and monitoring IAQ conditions like CO₂ and temperature—it ensures systems run only when needed, and only where needed.

    When combined with SENSE and ENERGY, SAFE enables even deeper optimization through pattern analysis and automated controls.

    📊 Studies from the U.S. Department of Energy show that smart environmental and occupancy-based controls can cut HVAC energy use by up to 30% in commercial spaces.

  15. Yes. When integrated with SENSE, SAFE doesn’t just monitor conditions—it learns from them. By analyzing historical trends, occupancy patterns, and environmental anomalies, it can:

    • Detect deviation from normal HVAC performance
    • Flag sensor drift or failures
    • Anticipate when equipment may require maintenance or recalibration

    This enables proactive facility management and avoids unexpected breakdowns—helping reduce maintenance costs and downtime.

  16. SAFE is ideal for any organization that prioritizes health, sustainability, and operational efficiency. This includes:

    • Offices: to improve productivity and reduce absenteeism
    • Retail stores & malls: to boost visitor comfort and trust
    • Public buildings, theaters & museums: to meet ventilation and comfort standards for better guest experience.
    • Factories & warehouses: to monitor working conditions and air quality
    • Healthcare & education: where IAQ and occupancy data are critical for compliance and well-being

    📌 Any facility aiming to improve its ESG performance, attract top talent, or optimize energy use can benefit from SAFE.

  17. SAFE offers flexible pricing plans tailored to your organization’s size, monitoring needs, and integration complexity. Pricing depends on factors like:

    • Number of sensors and monitored zones
    • Integration with other YodiFEM modules (e.g., SENSE, ENERGY, DESK)
    • Dashboard customization and reporting features

    Contact us today to request a demo and get a personalized quote that matches your facility’s environmental and sustainability goals.

  1. An Energy Management System (EMS) is a comprehensive framework that enables organizations to monitor, control, and optimize their energy consumption. It integrates processes and tools to systematically track energy usage, identify inefficiencies, and implement corrective actions to enhance energy performance.

    How it works:

    1. Data Collection: Gathers real-time and historical data from energy meters, sensors, and building management systems.
    2. Analysis: Utilizes analytical tools to assess energy consumption patterns, detect anomalies, and benchmark performance.
    3. Implementation: Recommends and facilitates the implementation of energy-saving measures, such as equipment upgrades or process improvements.
    4. Monitoring: Continuously monitors the impact of implemented measures to ensure sustained energy performance improvements.

    By providing a structured approach to energy management, an EMS helps organizations achieve significant energy savings and reduce operational costs.

  2. Investing in an EMS like YodiFEM’s ENERGY subsystem offers both immediate and long-term benefits:

    • Cost Savings: Implementing an EMS can lead to significant reductions in energy expenses. For example, according to research companies practicing energy management have achieved average savings of approximately 15% on their energy bills, with some cases reporting reductions of 30% or more.
    • Enhanced Energy Efficiency: An EMS provides a structured approach to monitor and optimize energy consumption, leading to more efficient use of resources. Studies have shown that deploying such systems can result in energy savings ranging from 11.39% to 16.22% annually.
    • Regulatory Compliance: An EMS facilitates adherence to energy regulations and standards, such as ISO 50001, which offers a framework for establishing, implementing, maintaining, and improving energy management practices.

    Sustainability: By reducing energy waste and optimizing consumption, an EMS contributes to lowering carbon emissions, supporting corporate social responsibility goals, and enhancing environmental stewardship.

  3. While ISO 50001 certification is not mandatory for implementing an EMS, it is highly beneficial for organizations aiming to standardize and formalize their energy management practices. YodiFEM’s ENERGY subsystem supports the path to certification by:

    • Structured Data Management: Organizes energy data in line with ISO 50001 best practices.
    • Automated Reporting: Facilitates reporting and KPI tracking aligned with the standard.
    • Integrated Compliance: Works seamlessly with EnGage for managing ISO 50001, ISO 14001, and other ESG frameworks.

    Organizations that have achieved ISO 50001 certification often experience significant benefits. For instance, broad implementation of ISO 50001 could drive cumulative energy savings of 62 exajoules by 2030, saving over $600 billion in energy costs and avoiding 6,500 Mt of CO₂ emissions.

  4. ENERGY is the energy management subsystem of YodiFEM, Yodiwo’s  Full ESG Management. It enables organizations to monitor, analyze, and optimize energy usage across buildings, assets, and operations — supporting both cost reduction and sustainability goals.

    It offers:

    • 24/7 real-time monitoring of electricity, gas, fuel, water, and more
    • Data integration from meters, sensors, and external systems( i.e.Billing Apps)
    • Cost and performance analysis through dynamic dashboards
    • Automated energy data feeds into ESG and compliance platforms like EnGage

    Whether you’re managing a single building or an entire portfolio, ENERGY empowers you to make informed, data-driven decisions that drive down consumption and carbon impact.

  5. Yes, ENERGY can support and simplify energy-related reporting for international standards like ISO 50001 and ISO 14064. While ENERGY itself is not a certification tool, it plays a vital role in the process by:

    • Structuring energy data according to ISO-compliant metrics
    • Tracking and visualizing energy performance indicators (EnPIs)
    • Creating tailored audit reports for compliance documentation
    • Integrating with EnGage, Yodiwo’s ESG data managment & reporting subsystem can automate the reporting of all ISOs and other sustainability frameworks

    .With ENERGY and EnGage together, your team can easily manage the data trail required for internal reviews or formal ISO audits — reducing reporting effort while improving accuracy and transparency.

  6. ENERGY integrates and harmonizes data from a variety of sources, creating a single, centralized view of your entire energy ecosystem. This includes:

    • Smart meters and sub-meters (electricity, water, gas, etc.)
    • IoT sensors for temperature, air quality, and equipment status
    • Building Management Systems (BMS) and automation protocols
    • ERP and utility billing systems
    • Digital twins and occupancy-based analytics
    • Weather data feeds for normalization and forecasting

    All data flows through Yodiwo’s WisperPro IoT Gateway, allowing ENERGY to support real-time and historical analysis, cross-building comparisons, and energy disaggregation at the device or zone level.

  7. YodiFEM’s ENERGY module offers powerful analytics tools that transform raw data into actionable insights. Key features include:

    • Energy Flow Visualization
      Understand where and how energy is being used across systems and sites.
    • Comparative & Disaggregated Analytics
      Break down energy consumption by building, asset, or device. Compare performance over time or across locations.
    • Anomaly Detection & Forecasting (via SENSE integration)
      Identify unexpected usage trends or potential equipment issues early using AI-based models.
    • Weather Normalization
      Adjust analytics for external factors like temperature or seasonal variations.
    • Energy Cost & ROI Calculators
      Track energy spending and validate savings from interventions or new technologies.
    • Automated Reporting
      Generate weekly, monthly, or quarterly energy reports with built-in visualizations for audit or executive review.

    These analytics help organizations not only save energy but also build a long-term strategy for operational excellence and ESG impact.

  8. Comparative analytics in the ENERGY subsystem enables facility managers to analyze energy consumption across different time periods, buildings, or zones—making it easier to:

    • Identify inefficiencies by comparing similar buildings or periods.
    • Evaluate the impact of energy-saving initiatives by measuring “before and after” data.
    • Detect abnormalities such as unexpected consumption spikes.
    • Prioritize interventions by pinpointing the most energy-intensive assets or locations.

    This feature turns raw data into actionable insights, helping teams make informed, cost-effective decisions that improve overall energy performance. According to the U.S. Environmental Protection Agency (EPA), buildings that consistently benchmark their energy usage achieve an average annual energy savings of 2.4%, culminating in a total savings of 7% over a three-year period.

  9. By integrating with BMS and IoT devices, ENERGY creates a unified, real-time view of your energy ecosystem. This integration allows you to:

    • Centralize data from HVAC, lighting, occupancy sensors, and meters
    • Correlate energy usage with operational factors
    • Enable smart control of systems and Receive real-time alerts when consumption deviates from expected patterns via SENSE

    📊 Stat Insight: Integration of IoT and BMS can result in up to 30% reduction in energy use and 20% savings in operational costs, according to peer-reviewed studies.

  10. The energy cost calculator in ENERGY translates technical consumption data into clear financial insights, allowing businesses to:

    • Understand total and per-zone energy spending
    • Evaluate ROI from energy-saving technologies
    • Forecast energy budgets
    • Uncover hidden costs tied to inefficiencies
    • Detect and resolve billing discrepancies

    In addition to the above the U.S Department of Energy states that organizations using Energy Management Information Systems (EMIS) report median annual savings of $0.27 per sq. ft., with deployment costs of only $0.05 per sq. ft.

  11. Energy benchmarking in ENERGY compares the performance of a building to others in your portfolio or to similar facility types. It works by:

    • Normalizing data by building type, usage, and weather
    • Generating baseline energy performance
    • Highlighting underperforming sites
    • Guiding improvement strategies and target setting

    The EPA notes that consistent benchmarking leads to 2.4% annual savings and helps increase asset value and tenant satisfaction.

  12. Energy flow visualization in YodiFEM provides a graphical, real-time representation of how energy moves through your building or facility. It helps users:

    • See where energy is being consumed across systems or zones
    • Detect irregularities such as excessive draw from certain equipment
    • Understand load distribution during peak hours
    • Communicate complex consumption data in an intuitive format

    This visual layer simplifies energy analysis and supports faster, more accurate decision-making when identifying waste or optimizing operations.

  13. Weather normalization adjusts your energy data to account for fluctuations in external climate conditions. By integrating weather data into systems like the ENERGY subsystem,  allows users to:

    • Isolate the true impact of energy-saving measures, unaffected by seasonal variability
    • Compare energy performance year-over-year on a level playing field
    • Forecast energy needs more accurately by correlating usage with historical weather trends

    This enables more reliable benchmarking, better budgeting, and smarter scheduling of systems like HVAC that are heavily weather-dependent.

  14. Energy disaggregation is the process of breaking down total energy consumption into individual components—such as by system (HVAC, lighting, machinery) or even specific devices. In YodiFEM, this feature allows users to:

    • Identify which equipment or areas are using the most energy
    • Detect energy inefficiencies at the source
    • Track the effect of upgrades or operational changes
    • Prioritize maintenance or retrofits based on actual impact

    Disaggregation gives a clear, actionable picture of where to focus efficiency efforts—leading to smarter investments and faster ROI.

  15. YodiFEM provides highly customizable, audit-ready energy reports designed for both technical and executive audiences. These reports include:

    • Daily, weekly, monthly, and quarterly summaries
    • Energy consumption trends over time
    • Cost breakdowns by area, device, or building
    • Performance against targets or historical baselines
    • Compliance-ready formats for ISO 50001, ISO 14064, and ESG standards (via EnGage integration)
    • Graphical insights like heatmaps, KPIs, and anomaly alerts

    Reports can be exported, automated, and tailored to different stakeholder needs—making energy oversight easier and more transparent across the organization.

  16. Energy verification in YodiFEM helps validate that energy usage data aligns with billing statements from utility providers. It works by:

    • Cross-checking actual consumption data (from meters and sensors) with billed amounts
    • Identifying discrepancies that may result from incorrect meter readings, misapplied tariffs, or estimation errors
    • Notifying facility teams in real time if usage spikes or patterns suggest billing inaccuracies

    This verification process ensures financial accuracy, audit readiness, and trust in energy data—protecting businesses from paying more than they should.

  17. Custom rules in YodiFEM allow users to define logic-based alerts and controls, especially when ENERGY is combined with the SENSE subsystem. Examples include:

    • Alert if HVAC runs outside working hours
    • Trigger notification if energy use exceeds a preset threshold in a zone
    • Automatically adjust lighting or ventilation when occupancy or CO₂ levels change
    • Detect simultaneous heating and cooling, which often signals inefficiency

    These rule-based automations enable proactive energy management, reduce waste, and help meet energy performance targets.

    Note: Custom automation rules require integration with SENSE.

  18. YodiFEM simplifies compliance with national and international standards by offering:

    • Automated ESG reporting through integration with the EnGage subsystem
    • Customizable audit-ready reports aligned with ISO 50001, ISO 14001, and ISO 14064
    • Built-in energy performance indicators (EnPIs) and normalized benchmarks
    • Exportable documentation for environmental audits and board reporting
    • Real-time dashboards to monitor performance against targets

    These features ensure that sustainability and compliance reporting is accurate, traceable, and hassle-free—supporting your ESG strategy with reliable, structured energy data.

  19. EnGage is Yodiwo’s ESG Data Management and Reporting subsystem. When integrated with YodiFEM’s ENERGY module, it creates a seamless link between operational energy data and your broader sustainability and compliance strategy.

    This integration enables:

    • Automated transfer of energy data into ESG and carbon reporting tools
    • Support for international standards, including ISO 50001, ISO 14064, and the GHG Protocol
    • KPI tracking for energy consumption, emissions, and performance targets
    • Digital audit trails for environmental and corporate disclosures
    • Centralized dashboards for real-time visibility across ESG metrics

    This makes EnGage the single source of truth for energy and sustainability performance—reducing manual reporting effort and boosting data reliability for audits or disclosures.

  20. Yes. One of YodiFEM’s biggest advantages is that it enables organizations to achieve major energy savings without the need for expensive infrastructure upgrades.

    Here’s how:

    • Intelligent monitoring helps identify and eliminate inefficiencies in current operations
    • Scheduling and rule-based controls optimize usage of existing HVAC, lighting, and other systems
    • Data insights help prioritize small changes (e.g., settings, maintenance) over capital-intensive replacements
    • Predictive analytics (via SENSE) identify underperformance before it leads to failure

    This means YodiFEM enables a “software-first” energy optimization strategy—getting more out of your existing infrastructure while delaying or avoiding costly retrofits.

  21. YodiFEM’s ENERGY module is built with Environmental, Social, and Governance (ESG) alignment in mind. It enables organizations to:

    • Track environmental performance metrics such as energy consumption, CO₂ emissions, and normalized efficiency indicators (e.g., kWh/m²)
    • Generate automated, audit-ready reports via EnGage integration for standards like ISO 50001, ISO 14064, and the GHG Protocol
    • Set and monitor ESG-aligned targets such as reductions in energy intensity or carbon footprint
    • Ensure traceability with digital data trails for internal ESG reviews, third-party audits, and investor disclosures
  22. YodiFEM supports ROI analysis by transforming technical energy data into financial and performance metrics. Key features that support this include:

    • Energy cost calculators to track consumption and cost by zone, device, or timeframe
    • Comparative analytics to evaluate energy performance before and after upgrades
    • Forecasting tools to model potential savings from operational or equipment changes (Via SENSE)

    These tools enable teams to assess which actions are truly delivering value—from new tech deployments to behavioral interventions.

  23. An EMS like YodiFEM’s ENERGY subsystem is essential for:

    • Facility managers responsible for energy efficiency, safety, and operational continuity
    • Sustainability leaders and ESG officers seeking accurate, auditable data for compliance and impact tracking
    • CFOs and procurement teams aiming to reduce energy spend and improve ROI
    • Operations and asset managers who need visibility into energy performance across buildings, equipment, or entire portfolios
    • Organizations subject to environmental regulations or aiming to achieve ISO certification or net-zero goals

    Whether you’re managing a single building or a multi-national real estate portfolio, ENERGY helps you take control of energy and align performance with broader business priorities.

  24. YodiFEM—especially when combined with the SENSE subsystem—enables predictive and preventive strategies through:

    • Anomaly detection algorithms that flag unusual energy patterns early
    • Trend forecasting based on historical usage, occupancy, and weather data
    • Custom rule creation to trigger alerts or actions when thresholds are exceeded
    • Correlation analysis to link energy waste with root causes (e.g., equipment failure, incorrect schedules)

    This proactive approach empowers teams to fix inefficiencies before they become costly—reducing downtime, waste, and unplanned maintenance.

  25. YodiFEM is offered under pricing model tailored to the scale and needs of each customer. Pricing is based on:

    • Number of buildings
    • Number of data points (e.g., sensors, meters, controllers)
    • Features used, including integrations with SENSE, EnGage, or other subsystems
  1. Smart retail management means using modern technologies—like sensors, data, and software—to run stores more efficiently.

    It helps store owners and managers:

    • Know what products are selling and which are not
    • See how customers move around the store
    • Make sure shelves are filled on time
    • Place the right products in the right spots
    • Save energy and keep products fresh

    With smart systems like Plano360, everything is connected: from the shelves to the stockroom to your head office. This means faster decisions, fewer mistakes, and a better shopping experience for your customers.

  2. IoT devices provide real-time data and visibility into all store operations. With a software like Plano360, retailers can:

    • Monitor environmental conditions like fridge temperature, humidity, and air quality.
    • Track customer movement using computer vision and demographic AI tools.
    • Use Bluetooth Beacons (YodiFind) for SKU tracking and theft prevention.
    • Trigger alerts for low stock, misplaced items, or eLabel malfunctions.
      These capabilities ensure optimized operations, better stock control, and enhanced shopper experiences.


  3. Smart retail systems increase operational efficiency, reduce manual errors, improve sales per square meter, and enhance customer satisfaction through data-driven decisions and automation.

    Investing in a system like Plano360 brings tangible ROI:

    • +12% sales per m²
    • +37% faster shelf replenishment
    • 97% planogram compliance
    • +15% seasonal product sales
    • +50% time savings for store staff
    • +40% store effectiveness
  4. Analytics provide deep insights into customer behavior, sales trends, inventory movement, and store performance. Retailers can make informed decisions on merchandising, promotions, and supply chain planning.


    A software like Plano360 consolidates data from ERP, POS, IoT sensors, and other systems into a central platform. It visualizes performance via heatmaps and KPIs (sales, margins, dwell time, footfall), enabling data-driven decisions on:

    • Product placement
    • Stock optimization
    • Staff allocation
    • Promo effectiveness
      The result: fewer mistakes, better forecasting, and continuous store performance improvement.
  5. Digital twins are 2D or 3D virtual replicas of physical retail stores. They help retailers visualize, plan, and optimize layouts, product placement, and customer journeys, leading to improved compliance and performance.

    Plano360 builds these using BIM files, furniture models, SKU lists, and store layout data. They enable:

    • Virtual planogram design and validation
    • Space measurement and shelf visualization
    • AR/VR client navigation
    • Remote audits and promo planning
      Digital twins eliminate guesswork in store management and drastically improve accuracy.
  6. Using sales history, store clusters, customer demand, and space strategy, Plano360’s AI engine predicts:

    • What products should go where
    • Which SKUs will underperform
    • Which stores need more/less inventory
      This minimizes overstock/out-of-stock situations and ensures each store’s layout is tailored to its real demand patterns.


  7. Planograms are visual layouts that dictate product placement on shelves.

    • They ensure consistency,
    • maximize space efficiency, and
    • align with merchandising strategies to boost sales.
    1. How do automated planograms differ from traditional planograms?

    Automated planograms:

    • Are created by AI based on inventory, space rules, and demand data
    • Can be released instantly to stores
    • Include visual change highlights
    • Support auto-replenishment logic


    Traditional planograms are manual, slow, and static. Plano360 automates the entire process and keeps every store aligned with HQ in real time.

  8. Heatmaps show high- and low-performing store zones using color-coded data. Heatmaps visualize customer behavior and sales intensity across store areas.

    Plano360 generates them based on:

    • Sales
    • Profit margins
    • Customer dwell time
    • Footfall
      This enables data-led space optimization—e.g., moving underperforming SKUs to high-traffic zones.
  9. Monitoring indoor conditions—such as temperature, humidity, air quality, and ambient light-is vital in retail for several reasons:

    • Product integrity & safety: Ensuring optimal fridge temperature and controlled humidity helps maintain the quality and safety of perishable products.
    • Customer comfort & experience: Proper air quality and ambient conditions contribute to a pleasant shopping environment and support overall well-being.
    • Operational efficiency & cost control: Monitoring systems reduce energy consumption and maintenance costs by detecting anomalies in HVAC or environmental systems early.
    • Proactive alerting & risk mitigation: The system can generate real-time alerts for out-of-spec conditions, minimizing spoilage, waste, or health risks.

    These capabilities support smarter retail operations, reduce losses, and enhance customer satisfaction—all core benefits of implementing an IoT‑powered platform like Plano360, which integrates environmental monitoring as a key component of store optimization.

    SAFE is Yodiwo’s environmental monitoring subsystem (part of their YodiFEM platform). It uses IoT sensors to collect and analyze data on indoor conditions—such as temperature, humidity, CO₂ levels, VOCs, and more—to proactively manage and maintain healthy spaces

  10. Big data uncovers trends in purchasing behavior, product preferences, and shopping patterns.

    Plano360 enables retailers to combine POS, CRM, ERP, and IoT data to:

    • Personalize assortments per store
    • Identify repeat visits and optimize layouts
    • Understand what drives sales in each cluster

    The result: smarter promotions, faster replenishment, and layouts tailored to real shopper behavior.


  11. Real-time data allows immediate responses to inventory issues, customer needs, and operational bottlenecks. It improves agility, reduces delays, and enhances store performance.

  12. Plano360 is an all-in-one smart retail platform that uses digital twins, AI, and IoT integrations to automate merchandising, space planning, planogram execution, compliance, and analytics. It’s trusted by top retailers for transforming their operations and improving sales, accuracy, and efficiency.


  13. Plano360 creates digital replicas of each store to simulate and optimize:

    • Furniture and SKU placement
    • Promo shelf localization
    • Customer flow navigation
    • Planogram creation and validation
      It’s the backbone of precise, scalable, and personalized merchandising at store level.
  14. The platform automates planogram workflows from HQ to shelf:

    • Planograms are generated based on space and sales data
    • Visual changes are sent to stores in real-time
    • Store staff use QR codes or eLabels for compliance audits
    • Photos or confirmations mark completion
    • Deviations trigger automatic alerts
  15. They help you identify:

    • Where customers linger
    • Which shelves underperform
    • Which promos convert
    • Which zones need layout changes
      Combined with IoT and CRM data, Plano360’s analytics engine delivers holistic store insights.
  16. It gives instant visibility into:

    • Where each SKU is placed
    • Out-of-stock alerts
    • Misplaced products
    • Replenishment triggers
      This ensures maximum product availability and sales uptime.
  17. IoT devices track environmental data, monitor product movement, support eLabel synchronization, and enable real-time SKU tracking and planogram compliance verification.

  18. Plano360 integrates with eLabels to remotely verify product placement, update shelf information, and receive status alerts (e.g. low battery), ensuring seamless and accurate compliance.

  19.  

    By analyzing historical sales, store layout, and customer demand, Plano360 predicts optimal product mix and shelf allocation, tailoring planograms per store cluster.

  20. Plano360 sends real-time alerts based on performance metrics, allowing immediate corrective actions like reallocation of products or reconfiguring shelf layouts.

  21. The built-in collaborative module allows:

    • Instant HQ-store communication
    • Real-time tracking of issues
    • Upload of photos and feedback
    • Measurable KPIs on resolution time


    It reduces internal complaints and ensures faster problem-solving.

  22. Plano360 is ideal for:

    • Visual merchandising teams
    • Retail operations and design teams
    • Space and category managers
    • IT innovation departments
    • Any large retailer looking to optimize store performance, reduce costs, and enhance the customer experience
  23. YodiFEM is offered under pricing model tailored to the scale and needs of each customer.

  1. Smart City Management is the centralized orchestration of urban infrastructure using a combination of IoT, AI/ML, digital twins, and edge computing.

    A Smart City Management  modular software like YodiCITY by Yodiwo integrates with existing infrastructure—like ERP, GIS, and mobility systems—collecting data from distributed sensors (LoRa, NB-IoT, Sigfox) to provide real-time insights and control over city assets. Core features include anomaly detection, predictive maintenance, KPI monitoring, and synchronized city-wide automation from a unified dashboard.

    1. Smart Waste Management uses IoT sensors, data analytics, and AI to monitor waste bin status, detect illegal dumping, and optimize waste collection routes. It helps municipalities reduce costs, fuel use, and environmental impact through real-time automation and data-informed decisions.YodiCITY’s Smart Waste module combines fill-level sensors, edge-computing image recognition, and machine learning to predict bin saturation and schedule optimized routes.
      Key features include:

      • AI-based violation detection (e.g. overfill, illegal dumping)
      • Predictive routing with the Waste Bin Best Routing Collection App
      • Real-time heatmaps showing fill status across zones
      • Sensor-agnostic compatibility (LoRa, NB-IoT, SigFox)
      • Admin dashboards and mobile reporting tools for citizens
  2. Smart Parking Management is a system that monitors, predicts, and manages the use of parking spaces using IoT sensors, cameras, and real-time analytics. It improves space utilization, reduces congestion, and enhances the driver experience through dynamic pricing and reservation tools.


    YodiCITY’s PARKING module delivers an end-to-end smart parking solution using sensor networks and AI cameras.

    It includes:


    • Real-time occupancy monitoring (on-street & off-street)
    • AI-based detection of parking violations
    • Mobile app for citizens to reserve, navigate, and pay
    • Enforcement app for authorities with live violation maps
    • Support for parking permits (residents, disabled, EVs)
    • Dynamic pricing based on zone analytics and peak demand
    • Open API for ERP, payment gateways, and public info displays
  3. Smart Traffic and Bicycle Management leverages AI, IoT sensors, and real-time analytics to optimize traffic flow, improve cyclist safety, and enable predictive congestion control. It includes adaptive signal control, real-time monitoring, and emergency routing.

    YodiCITY’s TRAFFIC module implements a comprehensive traffic management system using:

    • AI-enabled cameras and edge devices for traffic volume and incident detection
    • Real-time vehicle identification for congestion measurement
    • Adaptive traffic signals dynamically controlled by real-time inputs
    • Emergency vehicle prioritization through automated routing
    • Integration of bike lane usage analytics and environmental data
    • Predictive insights for planning new infrastructure

    All data is exportable in formats (.csv/.xls) and aligned with ISO 37120 KPIs for governance, safety, and environmental impact.

  4. Smart Air Quality Management involves continuous monitoring of pollutants and environmental conditions using distributed sensors, enabling data-driven decisions to protect public health and support sustainability goals.

    YodiCITY’s AIR module monitors PM1/2.5/10, NO, NO₂, CO, O₃, temperature, humidity, rainfall, pressure, and solar radiation through its:

    • Air Quality Stations
    • Weather Stations
    • Anemometer Stations (wind speed/direction)
      It features:
    • A real-time dashboard with geo-visual data indicators
    • Automated alerts to municipal operators and citizens
    • Historical data reporting for trend analysis and ESG reporting
    • Mobile app for public awareness and issue reporting
    • Full alignment with ISO 37120 Indicators 15.2.1 (Air Quality) & 16.3.1 (Health Outcomes)
  5. Smart Street Lighting automates lighting operations based on environmental conditions, motion detection, and usage patterns. It reduces energy waste, improves public safety, and lowers maintenance costs.

    YodiCITY’s LIGHT module offers advanced control and monitoring with:

    • Automated On/Off and dimming via astronomical calendars, light-level sensors, or motion detection
    • Weather-adaptive response through wind-speed sensors (anemometers)
    • Real-time fault detection and maintenance scheduling with GPS coordination
    • Energy analytics and seasonal usage heatmaps
    • Controller-agnostic design compatible with LoRa, NB-IoT, SigFox
    • Integration with LMS and public safety platforms
  6. Smart City Management Platforms provide municipalities with centralized, data-driven control over essential urban services. These platforms break down data silos, improve operational visibility, and enable cities to automate services, reduce waste, and improve citizen engagement. A robust smart city platform supports ESG goals, enhances sustainability reporting, and reduces costs by optimizing service delivery across traffic, lighting, air, waste, and more.

    YodiCITY’s value as a Smart City Management Platform:

    YodiCITY is a modular, sensor-agnostic, and interoperable platform that integrates data from thousands of IoT devices and city systems under a single unified interface.

    Key reasons to invest:

    • Centralized Control Panel: Manage waste, traffic, parking, air quality, lighting, and energy with one platform
    • Digital Twin Technology: 2D/3D replicas of city assets enable simulation, planning, and real-time monitoring
    • Real-Time Automation: AI/ML models detect anomalies, optimize services, and trigger alerts automatically
    • Predictive Maintenance: Reduces downtime and unexpected failures with forecasting and ticketing workflows
    • ESG & ISO 37120 Compliance: YodiCITY’s ESG4CITIES module simplifies sustainability data collection, KPI reporting, and funding eligibility
    • Mobile Apps: Apps for citizens (reporting, alerts, service usage) and enforcement teams (e.g., parking, lighting violations)
    • Cost Efficiency & Scalability: Up to 30% lower costs vs legacy platforms; deployment possible in phases for any city size
    • Integration Ready: Seamless connection to GIS, ERP, CRM, LMS, and payment/billing systems via open protocols (REST API, MQTT, LoRa, NB-IoT)

    Cities using YodiCITY have reported improvements such as 50% reduction in staff effort, 60% fewer emissions in waste management, 97% planogram (compliance-like) execution, and 40% improvement in service delivery efficiency.

  7. Smart Energy Management refers to the use of real-time monitoring, data profiling, and automation to reduce energy consumption and optimize building operations, often tied to ESG performance tracking and emission reduction goals.

    YodiCITY’s ENERGY module transforms municipal buildings into smart energy assets through:

    • Digital twin generation of physical infrastructure
    • Historical and real-time energy profiling via utility-grade metering
    • Forecasting tools that predict demand trends
    • Rule-based automation using PLCs and virtual sensors
    • Customizable alerts and automatic load control
    • Integration with BMS, EAM, and ERP platforms
    • Reporting aligned with ISO 37120 and CSRD frameworks
    • Reduced fuel usage (up to 15%)
    • Minimized maintenance via predictive fault detection
    • Enhanced public safety and air quality
    • Lower operational costs via automation
    • Compliance with global sustainability standards (ISO/GRI/CSRD)
  8. A Smart City Infrastructure consists of a digitally connected network of urban systems—using IoT, cloud computing, machine learning, and open protocols—to automate, monitor, and optimize public services in real time. These systems support mobility, safety, energy management, sanitation, and urban planning.

    YodiCITY’s architecture reflects all core Smart City infrastructure layers:

    1. IoT Sensors & Devices
    • Waste bin fill-level sensors
    • Parking occupancy sensors and AI-powered cameras
    • Air quality, weather, and anemometer stations
    • Streetlight controllers
    • Traffic counters and vehicle detection systems
    • Energy meters and PLCs
    1. Connectivity Layer
    • Support for LoRaWAN, NB-IoT, SigFox, WiFi, Ethernet, and BLE
    • Integration with BLE beacon systems (e.g. YodiFind for SKU/assets)
    1. Edge Gateways & Local Processing
    • Real-time anomaly detection and pre-aggregation at the edge
    • Video analytics for traffic and dumping violations
    • Low-latency response mechanisms for lighting and signals
    1. Core Smart City Platform (YodiCITY)
    • Centralized admin dashboard (web-based UI)
    • Digital Twin Engine: Geospatial 2D/3D modeling of city assets and zones
    • Analytics & AI Engine: Historical trend analysis, real-time alerts, forecasting
    • Workflow Automation: Custom alerts, rules, and maintenance ticket generation
    • Data Lake Integration for storing raw and processed data
    • Custom KPI Tracking per module and department
    1. Interoperability & Integration Layer
    • RESTful APIs, MQTT, FTP, CSV, XLS support
    • Integration with ERP, CRM, GIS, SCADA, payment systems
    • Bridges to Power BI and third-party BI/reporting systems
    1. Citizen & Operations Interface
    • Mobile Apps for citizens (e.g. reporting, parking, air quality)
    • Operations apps (e.g. Parking enforcement, lighting fault audits, bin status)
    1. ESG Compliance & Governance Layer
    • ESG4CITIES module with ISO 37120 KPI mapping
    • Aligned with CSRD, GRI Standards, and EU taxonomy
    • Real-time dashboards for compliance scoring, audit export, and funding eligibility

    YodiCITY delivers a vertically integrated infrastructure stack that can support small municipalities or scale to mega-cities with distributed assets and complex interdependencies.

  9. Yes. YodiCITY effectively reduces traffic congestion by using real-time traffic monitoring, AI-based pattern analysis, and dynamic control of urban mobility infrastructure. It enables cities to shift from reactive to predictive traffic management, allowing for smoother vehicle flow, reduced travel time, and faster emergency response.

    How it works:

    YodiCITY’s TRAFFIC module integrates a distributed network of AI-enabled sensors and smart cameras placed across intersections, arterial roads, and bicycle routes. These sensors continuously feed data into the platform’s analytics engine, which evaluates congestion levels, detects incidents, and forecasts peak-time surges.

    Based on this data, YodiCITY dynamically adjusts infrastructure, including:

    • Traffic signal timings (green light phasing)
    • Lane priorities
    • Emergency vehicle routing
    • Alerts for incident response teams

    It also uses machine learning models trained on historical traffic data to predict congestion before it forms, enabling preemptive adjustments to road flow policies and signal control.

    Key technical features:

    • AI-Powered Traffic Cameras & Sensors
      Collect live data on vehicle speed, count, direction, and type (e.g. car, truck, bicycle).
    • Adaptive Signal Control
      Real-time signal timing optimization based on flow density at each junction.
    • Predictive Congestion Forecasting
      Forecasts volume surges and diversion needs based on time-of-day, weather, and historical patterns.
    • Emergency Routing Engine
      Enables prioritized routing for ambulances, police, or fire vehicles during emergencies.
    • Incident Detection & Alerting
      Uses computer vision to identify sudden stoppages, accidents, or unusual congestion patterns.
    • Historical Traffic Reports & Heatmaps
      Visualize traffic trends by street, time, or event for planning infrastructure upgrades.
    • Open Integration with Mobility Platforms
      Syncs with existing city bus, tram, or micromobility systems for unified traffic intelligence.
    • Live detection of hazardous air quality events: Sensors detect pollution levels in real time (e.g., PM2.5, NO₂, CO), allowing city teams to respond instantly to critical environmental risks before they escalate.


    • Correlation with health data (e.g. asthma incidents): Air quality data can be analyzed alongside health records to identify links between pollution and respiratory issues, supporting targeted public health strategies.


    • Compliance with urban air quality mandates: Continuous data collection ensures cities meet regulatory standards like ISO 37120 and simplifies reporting for ESG and sustainability frameworks.


    • Spatial visualization of pollution with GIS overlays: Real-time sensor data is mapped geographically to highlight pollution hotspots, helping planners take localized, data-driven actions.


    • Predictive health risk modeling: Historical and real-time data can be used to forecast pollution trends and anticipate health risks, enabling preventive measures in high-risk areas.
  10. Yes. Smart lighting systems can significantly reduce energy consumption and enhance public safety by using sensors, automation, and centralized control to manage lighting levels based on actual need, not fixed schedules.

    Specifically it achieves:

    • Up to 30–40% energy savings through dimming schedules
    • Improved visibility reduces crime and accidents
    • Alerts and automation reduce downtime by 70%
    • Integration with other modules (e.g. traffic or emergency response)


    How it works:

    YodiCITY’s LIGHT module uses sensor-driven, autonomous lighting control that adjusts brightness levels depending on time of day, ambient light, motion detection, and weather conditions. The system not only ensures well-lit public areas during high-traffic or dangerous periods, but also dims or turns off lights when areas are unoccupied, saving energy and reducing operational costs.

    Real-time fault detection and maintenance automation further support infrastructure efficiency and safety by minimizing outages.

    Key technical features:

    • Autonomous On/Off & Dimming Control
      Based on astronomical calendars, light level sensors, and motion detectors.
    • Anemometer Integration
      Adjusts lighting behavior according to wind speed and weather safety thresholds.
    • Fault Detection & Maintenance Scheduling
      Real-time reporting of outages, with automatic generation of GPS-tagged maintenance tickets.
    • Energy Usage Analytics & Heatmaps
      Track and visualize consumption trends seasonally or by zone.
    • Open System Compatibility
      Supports various streetlight controller vendors (LoRa, NB-IoT, SigFox) for flexible deployment.
    • Integration with Other Modules
      Lighting behavior can adapt in coordination with TRAFFIC systems for dynamic response (e.g., brighter lights for emergency vehicle routes or accident zones).
  11. Data analytics plays a central role in optimizing urban infrastructure by turning raw sensor and system data into insights that improve operational efficiency, reduce waste, prevent failures, and support long-term planning. It enables cities to make informed decisions in real time, identify inefficiencies, and predict future issues before they happen.

    With data analytics, municipalities can:

    • Monitor infrastructure performance through KPIs

    • Predict when maintenance is needed

    • Allocate resources more effectively

    • Detect anomalies in usage or system behavior

    • Inform city planning and policy based on real-world trends


    YodiCITY’s platform is built around data analytics as a core engine. Each module (TRAFFIC, WASTE, LIGHT, AIR, ENERGY) continuously collects data from IoT sensors and external systems (e.g., ERP, CRM, GIS) and feeds it into a centralized analytics environment.

    Key capabilities include:

    • Real-time dashboards and alerts for each operational area

    • Predictive analytics (e.g., bin fill level forecasts, traffic congestion forecasting)

    • Custom KPI tracking based on city-defined performance goals

    • Heatmaps and spatial visualizations for identifying hotspots and inefficiencies

    • Data exports and integration with Power BI or other BI/reporting tools

    • Cross-domain insights for multi-variable optimization (e.g., linking lighting usage with traffic flow or air quality)

    YodiCITY empowers cities not just to observe what’s happening—but to continuously improve how the city works, based on real-time and historical evidence.

  12. Yes. Smart waste management solutions improve urban cleanliness and sanitation by ensuring timely, optimized waste collection, preventing bin overflows, reducing illegal dumping, and enabling faster issue resolution.

    How it works:

    YodiCITY’s WASTE module combines fill-level sensors, AI image recognition, and predictive routing algorithms to streamline how waste is monitored and collected. Real-time data helps city teams plan the most efficient routes, prevent missed pickups, and ensure public areas remain clean.

    Citizens can also report overflowing bins or illegal dumping via the mobile app, which improves responsiveness and civic participation.

    Key technical features:

    • Smart Bin Fill-Level Sensors
      Constant monitoring of each bin’s usage to prevent overflow and unnecessary pickups.
    • Edge Computer Vision
      Detects illegal dumping or misplacement of waste using AI-powered image analysis.
    • Predictive Routing Optimization
      The Waste Bin Best Routing Collection App generates fuel-efficient and time-saving routes based on real-time data and trends.
    • Dynamic Alerts & Violation Detection
      Alerts triggered by bin thresholds or unauthorized dumping, with auto-ticketing and task assignment.
    • Heatmap Visualization
      Identifies areas with consistently high waste generation or problematic patterns.
    • Citizen Mobile App Integration
      Citizens can report waste issues directly, increasing transparency and enabling rapid response.
    • Sensor Agnostic Architecture
      Compatible with a variety of IoT sensor technologies (LoRa, NB-IoT, SigFox) to suit existing municipal infrastructure.
  13. Digital twins in YodiCITY are interactive 2D/3D replicas of urban assets.
    Used for:

    • Simulation of new infrastructure layouts
    • Virtual compliance audits
    • Testing energy, traffic, or waste scenarios
    • AR/VR navigation or training
  14. AI models trained on historical sensor data forecast failure points across lighting, traffic signals, or bins. When thresholds are exceeded, workflows auto-generate maintenance tickets linked with asset IDs and GPS locations.

  15. Yes. Features include:

    • Parking discovery/reservation
    • Air quality alerts and feedback
    • Waste bin status and complaint reporting
    • Real-time updates from city departments

    See more here: https://www.facebook.com/watch/?v=373120348821297

    • GDPR-compliant design
    • Role-based access control
    • End-to-end encryption for data-in-motion
    • Enforced anonymization policies for citizen data
    • Audit logs for all data transactions
    • Emergency signal priority for responders
    • Real-time inter-module alerts (lighting, traffic, etc.)
    • Dynamic resource reallocation (e.g., redirecting traffic, lighting hazardous zones)
    • Command center dashboard with escalation workflows
  16. Yes. It is designed for modular deployment:

    • Works on cloud, edge, or hybrid environments
    • Sensor-agnostic with over 20 supported protocols
    • Scalable from 1–1000+ assets per domain
    • Pilot and full-scale rollout options
    • Plug-and-play with ERP, BMS, LMS, and CRM
    • Supports CSV, REST API, MQTT, OPC-UA, and FTP interfaces
    • Backward compatible with analog devices via digital bridges
    • Unified data lake model across all modules
  17. YodiFEM is offered under pricing model tailored to the scale and needs of each customer.

  1. ESG (Environmental, Social, and Governance) data management & reporting software helps organizations collect, organize, track, and report sustainability-related metrics in one centralized platform. This type of software is critical today because companies must comply with increasingly complex regulations (like CSRD, GRI, SASB, EU Taxonomy), prove transparency to stakeholders, and make strategic decisions backed by real data. EnGage eliminates the dependency on Excel spreadsheets and manual reporting, reducing risks, improving auditability, and supporting long-term ESG strategy.

  2. An ESG platform like EnGage helps organizations reduce complexity, improve performance, and stay compliant. Key benefits include:

    • Up to 75% reduction in ESG workload through automation of data collection, validation, and reporting.
    • 90% lower compliance risk with built-in audit tools, traceability, and CAPA workflows.
    • Up to 30% improvement in ESG scoring, leading to stronger investor appeal and better RFP success rates.
    • Estimated financial benefit of up to 20% of sales, from CO₂ reduction, better sourcing, and efficiency gains.
    • Real-time benchmarking across sites or suppliers to drive continuous ESG performance improvement.
    • Enhanced brand value and employer reputation, attracting better talent and increasing customer loyalty.
    • Estimated brand equity ROI of €50K+/year for mature ESG programs with transparency and traceability.
  3. EnGage centralizes all ESG metrics — environmental (emissions, energy, waste), social (DEI, safety, labor practices), and governance (board structure, compliance) — into a unified dashboard. Users can define custom KPIs or use pre-built frameworks. KPIs are updated in real-time via integrations, with trends, deviations, and corrective actions visible across organizational levels.

  4. Yes. EnGage is designed for ease-of-use with:

    • Predefined templates for reports and KPIs
    • Role-based dashboards for simplified navigation
    • Drag-and-drop Corrective Action tools
    • AI assistant (“ESGuru”) to answer questions and guide users
    • Intuitive UI for users with no ESG or technical expertise
  5. EnGage includes templates and logic to support CSRD, GRI, SASB, EU Taxonomy, ISO 14001, 14064, 50001, and more.

  6. Yes. EnGage includes:

    • AI-driven validation engine
    • Automatic error flagging
    • Logical consistency checks
    • Suggestions for correction before data is finalized or exported
    • Rule-based alerts for abnormal KPI trends


  7. Absolutely. EnGage supports:

    • One-click export of audit-ready disclosures
    • Custom branding of reports with widgets and narratives
    • Compliance-ready outputs for CDP, CSRD, GRI, ISO, and more
    • Export formats: PDF, CSV, Excel
  8. Yes. EnGage supports robust role-based access control (RBAC), allowing administrators to assign specific permissions based on a user’s role, department, or location.

    Each user sees only the data, tasks, and KPIs relevant to their responsibilities, improving focus, data security, and collaboration.

    Additionally, EnGage provides personalized dashboards tailored to each user’s role -whether they’re in sustainability, finance, HR, operations, or compliance — offering real-time visibility into their duties, performance metrics, and pending actions.

    This ensures every stakeholder has the right information at the right time, without overwhelming or irrelevant data.

  9. EnGage is designed to scale across all business types and industries, making it ideal for:

    ✅ Large Enterprises & Multinationals

    • Consolidate ESG data across multiple entities, geographies, and business units.
    • Manage compliance with complex regulatory frameworks like CSRD, GRI, EU Taxonomy, and SEC climate disclosures.
    • Handle Scope 3 emissions across vast supplier networks.

    ✅ Mid-sized Companies & SMEs

    • Use pre-configured templates, AI-powered assistants, and automated reporting to meet ESG obligations with minimal resources.
    • Easily onboard teams without ESG expertise thanks to user-friendly interfaces and guided workflows.

    ✅ Sector-Agnostic Flexibility

    EnGage is already trusted across:

    • Technology
    • Manufacturing
    • Financial services
    • Retail
    • Logistics
    • Public sector organizations
  10. EnGage integrates with ANY 3rd party system and extracts data from:

    • ERP (SAP, Oracle)
    • HR systems (Workday, BambooHR)
    • IoT devices & SCADA systems
    • CRM & procurement tools
    • Energy & utility APIs (e.g. DEDDIE)
    • SharePoint, email, Excel, CSV, PDFs
    • Image attachments processed via AI & OCR
  11. Yes. EnGage offers comprehensive tracking and reporting for Scope 1, 2, and 3 emissions, aligned with standards like the GHG Protocol, ISO 14064, and CSRD.

    • Scope 1 & 2: Supports real-time integrations (IoT, SCADA), manual entry, and AI-powered bill parsing. Includes location- and market-based methods for Scope 2.

    • Scope 3: Covers all 15 categories using built-in access to 190,000+ verified emission factors (via Climatiq), and AI-powered data extraction from invoices, PDFs, and travel docs.

    • Advanced tools: Emission breakdowns by asset, source, supplier, or category with full traceability and export-ready reports.

    EnGage helps companies gain accurate, audit-ready insights into their total carbon footprint.

  12. Yes. The system provides:

    • Real-time dashboard updates
    • Notifications for threshold breaches or missed KPIs
    • Automated alerting for CAPA deadlines or audit flags
    • Live task tracking and internal ticketing for corrective actions
  13. Highly scalable:

    • Multi-entity support with hierarchical data access
    • Language/localization features
    • Local data entry with centralized governance
    • Benchmarking across regions or business units
    • Country-specific emission factors and reporting alignment
  14. Yes. Users can:

    • Create custom KPIs for ESG, financial, or hybrid metrics
    • Automate formulas across any hierarchy level
    • Link KPIs with CAPAs, documents, or risk management tools

    Use virtual sensors and system-derived metrics

  15. Yes. EnGage is built for auditability:

    • Full version control on every entry
    • Action logs showing who did what and when
    • Auditor access portal for secure data reviews
    • Corrective Actions are traceable to each audit finding
  16. Yes. Benchmarking tools allow:

    • Performance comparisons between business units or suppliers
    • Trend analysis over time
    • Customized views per region, industry, or emission type
    • Data filtering by site, date, category, or KPI set


  17. Yes. The Supplier Management Module enables:

    • Supplier onboarding and account setup
    • Predefined or custom frameworks for suppliers
    • Role-based data entry with AI support
    • Supplier scoring, benchmarking, and progress tracking
    • Reports per supplier, group, or full list
  18. Pricing is customized based on:

    • Company size
    • Number of modules
    • Complexity of integrations and emissions reporting needs


    Contact the EnGage team for a tailored proposal.

  1. Yodiwo is a Swedish‑Greek technology company founded in 2015, with main offices in Patras, Greece and Sweden. It develops AI- and IoT-powered platforms for ESG data management, smart cities, workspace & energy management, and retail optimization for 360o ° Sustainability. Since its inception, Yodiwo has completed over 600 projects—including 13 municipal smart city implementations—across industries such as retail, manufacturing, banking, healthcare, and real estate.

  2. Yodiwo offers YodiFEM, a comprehensive Full ESG Management platform that integrates powerful technologies like AI, IoT, and advanced automation to help organizations manage sustainability across every aspect of their operations.

    YodiFEM is modular and customizable, designed to cover the full spectrum of ESG and operational needs through the following subsystems:

    • Seamless ESG Data Management & Reporting
      Automate ESG reporting, compliance (e.g. CSRD, GRI), KPI tracking, and audit readiness across Scopes 1, 2, and 3.
    • Workspace Management
      Manage hot desking, space bookings, and occupancy analytics to optimize building usage and employee productivity.
    • Smart Retail Management
      Planogram automation, digital twins, real-time inventory visibility, and merchandising performance optimization.
    • Asset & Energy Management
      Monitor and optimize energy usage, equipment status, and sustainability KPIs using predictive analytics and ISO-aligned tools.
    • IoT Data Management & Analysis
      Centralize and process real-time data from sensors, meters, and systems across buildings, cities, or operations.
    • Task Management
      Assign, track, and automate ESG-related or operational tasks with integrated workflows and performance tracking.
    • Employee Scheduling & Shift Planning
      Create and manage smart employee schedules that align with ESG and wellness policies, reducing overwork and increasing productivity.
    • Smart City Management
      Solutions for parking, waste, traffic, air quality, and lighting — all aligned with ISO 37120 for sustainable urban development.
    • Environmental & Wellness Control Systems
      Monitor indoor air quality, comfort levels, lighting, and environmental conditions for employee wellbeing and building compliance.

    Together, these modules form a single, interoperable platform that supports organizations of any size — from enterprises and manufacturers to municipalities and retailers — in achieving measurable ESG impact with full control and visibility.

  3. Yodiwo follows enterprise-grade security practices, ensuring:

    • End-to-end data encryption (in transit and at rest)
    • Role-based access control and user authentication
    • GDPR compliance and adherence to ISO security frameworks
    • Regular audits, secure APIs, and encrypted integrations

    Client data is strictly isolated per tenant, with full traceability and audit logs.

  4. Yodiwo was founded in 2015 and has over 9 years of experience delivering smart infrastructure and ESG solutions. The team includes experts from IoT, AI, energy, urban tech, and sustainability sectors.

  5. Yodiwo’s mission is to help organizations digitally transform for sustainable growth by providing tools that:

    • Automate ESG and operational processes
    • Improve data accuracy and transparency
    • Reduce environmental and financial risk
    • Empower teams through user-friendly platforms and intelligent decision-making
  6. To create a world where innovation and data intelligence lead to greener, more efficient organizations. Yodiwo aims to make sustainability practical and scalable across all sectors.

  7. All Yodiwo platforms are:

    • Cloud-native and API-driven
    • Modular and easily integrated into legacy or third-party systems
    • Built to scale from SMEs to large multinationals and city-wide deployments
    • Able to support multi-entity, multi-location, and multilingual environments

    Custom configurations and AI-assisted automation ensure futureproof scalability.

Image for Map

A last call to action title goes here

Request a demo to see how our platform simplifies sustainability and compliance.
lorem ipsum dolor sit amet

learn more